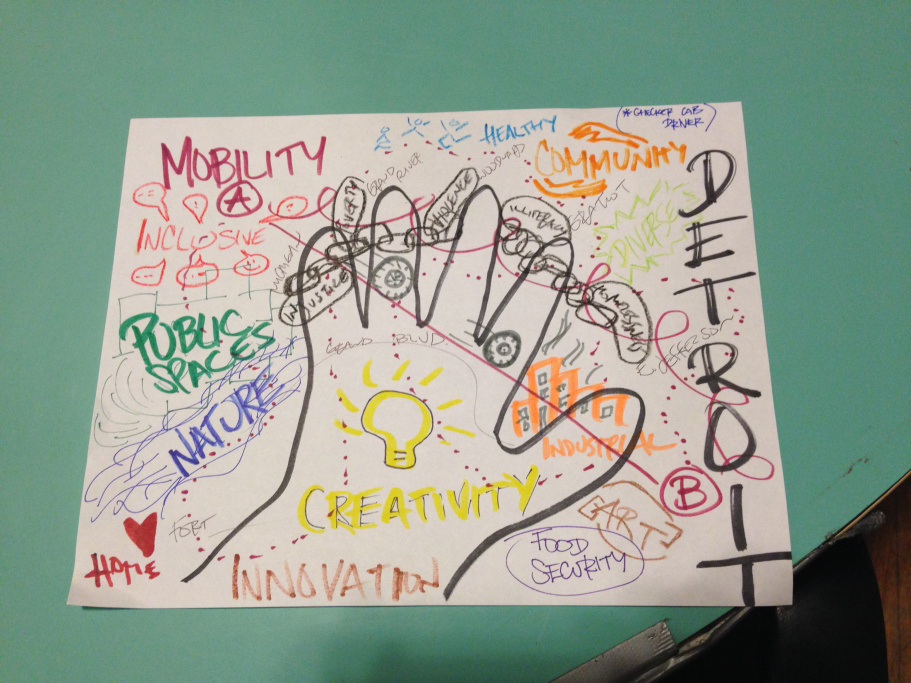
Hand map image courtesy of Alex B. Hill
Alex B. Hill is a Detroit-based cartographer, community advocate and editor of DETROITography, a blog about Detroit told through maps. He also manages detroitdata.org, an independent open data site, and is a strong advocate of open-source data, software and public mapping.
Hill teaches open-source mapping as a tool to empower grassroots groups to effect community change through a class called Data, Mapping and Research Justice. He says anyone who knows how to use a computer can get up to speed with mapping technology to map assets, demonstrate social problems and measure community impact.
This interview is lightly edited for clarity.
Shareable: How did you come to do map-based community advocacy work?
Alex B. Hill: I think it really started when I was a Boy Scout, and I first had to use a compass and a topographic map. The first map that I ever made was around 2005, when I took my uncle’s handheld GPS, and hiked the local nature trails so that I could make a better wayfinding map, and also to get more people to use the nature area. I remember then it was so difficult to find some free online mapping services. It ended up I had to use a marker to draw the trails because I couldn’t figure out the digital technology. On the digital map, I was only able to drop points at the main trail intersections. Then I had to use Crayola marker.
It wasn't the most accurate map, but I guess I can say that’s why I first started making maps, trying to get people to use the nature area more. Then around 2009, I started teaching myself more GIS [Geographic Information System] technology, and using the software.
That was at the same time I moved to Detroit. I ended up finding that I was making a lot of maps about Detroit. I started having spatial questions about different things I was seeing and experiencing.
The first map you made had to do with helping people access their local resources. And you've continued down that thread in your teaching and advocacy work. Where did that interest come from?
That’s a good question. I guess I personally had utilized the nature area a lot for hiking and biking, and my family would often do that. I had a personal connection to that place. I think that’s where most of this came from.
My map-based advocacy is relatively recent. I’ve been involved with nonprofits and social issues from a very young age, but didn’t really start using maps and data to make my points until I really dug into teaching myself GIS technology. I started a nonprofit in 2001 that supported small-scale health projects in African countries, so I was regularly using maps to help people better understand the geography of the African continent. In 2007, I was part of a fellowship program for progressive student leaders and [was] really grounded by international and local efforts to support community-led outcomes.
For Detroit specifically, I was tired of seeing the wide range of maps and data that seemed to leave out people and the barriers that people face. There are a handful of groups focused on using maps and data for various reasons, but too few engage people in making maps about their own experiences and their own communities.
You teach a class called Data, Mapping and Research Justice as part of Co.Open, a Detroit-based "media making cooperative." Who attends this class, and why do they attend?
The class is geared towards beginners, so they don’t have to have any GIS knowledge before going in. There have been university students, people involved in local non-profits, and also community organizations.
They attend for different reasons. Some of the students, we’re helping to use mapping in their research. Some of the nonprofits are hoping to better show their impact by being able to put their data on a map. Some of the community organizations were trying to show spatially the social issues they were working on, or they were trying to figure how to use maps to do their work better, where they could target different areas.
For example, a community organization had for a long time been working on asset mapping. They were mapping grocery stores and urban gardens. They were interviewing business owners and making sure that the businesses were committed to the community. They had a map, but they wanted to have it online. It was in paper form; they were drawing marks on a page. They wanted to make that more interactive, and more easily updateable.
From the class, they were able to better understand GIS technology, data management, and the next steps that they needed to take their map from a piece of paper to a digital or interactive map. And that helped them get the information on their website out to the community, and helped them better do their survey.
One of the big things that we do in the class is paper-based data collection. We do basics in GIS, and then we do paper-based data collection, and then students build their own databases to make their own maps.
What are the technology tools that you teach?
The class is focused on using free and open source tools. For GIS, we’re using QGIS, which is free software. Other software we use is free and open source. I don’t know if that’s important, but we use Google docs for making spreadsheets, and Inkscape for doing graphics.
The main thing is to have the software be accessible to anyone. The best part about having open source tools is there are so many people online in community to help run the software. People are regularly posting questions and answers. If you’re not sure how to do something, you can usually Google it, and someone has written a tutorial.
What are the kinds of skills people need to do this type of work?
I try to keep the class accessible. People don’t need any skills. They just really have to have an interest in data and maps. Most people already have most of the skills we use in the class, like making a spreadsheet, and basic computer literacy. That’s not always easy. We have had some older members from the community who are trying to learn. Sometimes it was a lot for them.
Sometimes people are intimidated by maps and data. How do you make less tech-savvy people feel more comfortable with a topic that can seem complex and overwhelming?
We start class with a hand map. It helps people to have an understanding that the maps that we typically see, [with] the hard boundaries and all the data, those don’t always have to be the most important maps. We also have these kinds of mental maps that help people describe their experiences.
With the hand map exercise, I always ask people map their Detroit. For some people, that’s what little they know about Detroit, since we had some students from U of M at Ann Arbor. For others, they almost had too much to put the map because they’ve been living in Detroit for 60-some years.
The hand map exercise is from the Detroit Geographic Expedition and Institute. They were a group in the ‘60s and ‘70s led by the radical cartographer, William Bunge. He was really focused on getting community members to map their own communities and to teach them skills to do that.
I always do the hand mapping activity first to focus people on how you can map a personal experience or how you can tell a story through a map without having to have hard numbers and data. You don’t have to follow the boundary lines of the city to tell the story of the people who live there.
What are some resources available to people who can’t attend the class in Detroit that can help them get started on mapping for community-based advocacy work?
Everyone should come to Detroit, and take the class! But if they can't, I guess the biggest resource that people can find is digging into those open source communities. If they’re really interested in learning, make an attempt to download QGIS and look for some tutorials. There’s a lot of message boards where you can ask questions, or people may have already asked a question that people want.
Also, look for your local #Maptime. It's an international network of free workshops, where people can find like-minded people who can probably give them in-person support.
For maps and data, people can reach out to their local government for that information. I like a lot of the historical maps as well. You could find those at the library or if there’s a local historical society. Also look to your local university. They might or might not have a geography or GIS program, but people in academia are usually excited about helping other people learn.
Anything else that you’d like to add?
I just think the biggest thing that I try to do, I don’t know if I always succeed, but my goal is always to center maps back on people, as opposed to the data or the actual map. It’s really about the people affected, and being able to help people to tell the story of their community. As we build new technologies and dig further into “big data” we need to remain human-centered in both our processes and outcomes.


