Maps have always served multiple purposes, all bearing the intentions of their creators: utilitarian tool, political document, artistic artifact, source of inspiration, register of historical injustice. In his book Maps of the Imagination: The Writer as Cartographer, anthropologist and novelist Peter Turchi explains how maps simultaneously expand and shrink the world:
The map neatly shows us something no one has ever seen. This is true not only because a curved and irregular surface has been flattened, but because any eye far enough away to take in the entire continent would almost certainly have seen clouds, and more certainly would not have seen the political borders of states, or place names. The colors of the land have been carefully selected to create an “elevation tint scheme.” This “clear” image, then, is an artistic representation of certain natural and political features. It is an intellectual construct.
While interactive maps share many of these age-old limitations, they can also reveal more than their creators could possibly know. A convergence of open data initiatives, affordable data processing, GPS-equipped mobile devices, and easily-available data visualization tools is enabling the creation of maps that expose previously unseen economic, social and cultural trends. Design firms, journalists and hackers are exploding the notion of a map to create tools that are as revelatory as they are aesthetically pleasing.
This year, we’ve seen Mutual Aid in Motion.
From scaling sharing hubs to Mutual Aid 101 trainings, we’re helping communities build the tools they need.
Every dollar fuels lasting resilience – proving that when we move together, we all move forward.

Mapping Collective Behavior in Real Time
Urban Mobs – Paris handovers 2 by QNTV
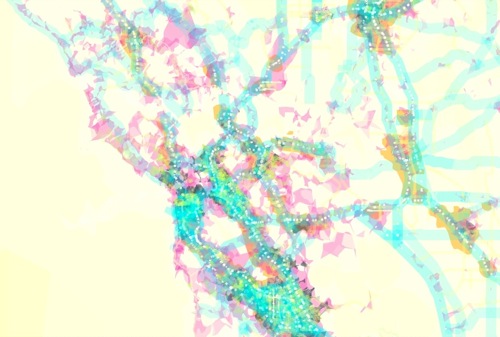
Urban Mobs is a 2008 project by European mobile provider Orange and FaberNovel that aimed to develop a “popular emotion cartography” by mapping cell phone usage within large crowds. Focusing on specific events that drew large crowds, such as the World Music Day in Paris, Urban Mobs created time-elapsed visualizations of the movement of cell phone owners over the course of the day, tracking the timing and usage of text messages along with other usage statistics.
What is the Ushahidi Platform? from Ushahidi on Vimeo.
The Urban Mobs project was ultimately a PR exercise for a mobile phone company, and therefore focused on uncontroversial events. However, such insight into collective behavior and the spread of information among crowds has significant implications. Crisis Commons and Ushahidi use real-time data aggregation and interactive maps to improve the effectiveness of disaster response efforts. These tools also can help social activists empower the voiceless and organize mass-scale public actions. Of course, the flip side is that the same data-gathering tools can be used by media organizations and governments to obfuscate facts and track and stifle dissent.
Crimespotting and Cabspotting

San Francisco’s Stamen Design creates maps and visualizations that reveal new insights about cities. In 2007, Stamen’s technology director Mike Migurski built Crimespotting Oakland as an alternative to the limited crime tracking tools that the city offered. The service does a daily pull from the city’s public Crimewatch data, and compiles it into an interactive tool that allows citizens to track crime and police beats in their neighborhoods, and reveals crime trends through time-elapsed visualizations. The service has been expanded to San Francisco, and has an open API for developers to build upon.
Stamen sees these maps as both a public service and a provocation, declaring on the Crimespotting San Francisco site, “We’ve found ourselves frustrated by the proprietary systems and long disclaimers that ultimately limit information available to the public. As citizens we have a right to public information. A clear understanding of our environment is essential to an informed citizenry.”

Stamen’s Cabspotting project uses a unique source of data to map economic trends. Collecting GPS data from Yellow Cab’s central dispatch server, Cabspotting tracks the movement of cabs around San Francisco. By tracing the movement of cabs, the tool offers nearly real-time representations of political and economic trends in the city by showing where fares are being transported, and the low-income areas where cabs rarely travel.
Mapping bike sharing need and usage
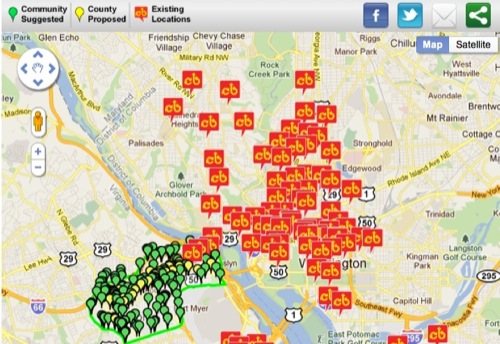
Interactive maps are informing both the planning process of bike sharing programs, and tracking their usage. Metrobike, which is expanding the Capital Bikeshare program to Arlington County, VA, used information from a crowdsourced map developed by Bike Arlington to help determine locations for bike sharing stations. Citizens were able to provide feedback on proposed locations using the mapping tool or social media. New York City Bike Share is currently using a similar tool to receive station location suggestions and solicit feedback for the city’s in-development project.

Since they’re outfitted with GPS units, bikes in city bike sharing systems are an excellent way to map the usage of such systems, as well as the movement of cyclists through a city. Oliver O’Brien, research associate at the University College London, has developed over 30 maps of bike share usage in cities around the world, tracking how the systems are being used. The results are revealing: as Noah Kazis at StreetsBlog observes, adoption of bike share services in American cities such as Denver, Minneapolis, and Washington D.C. lags behind usage in cities such as Paris or London.
Collecting unbiased data is a difficult if not impossible task, and any map will bear the partiality and intention of its creators at some level. Interactive maps can be used for empowering or self-serving purposes, to give voice to the voiceless or stifle dissent, to reveal injustice or sell more phones. Yet as cartographic tools evolve in real-time, these maps are revealing hidden systems that demarcate our world, and their potential as a tool for social change has never been more promising for those who seize the opportunity.
More Interactive Map Projects of Note
- Chicago Open Public Spaces Map
- Diabetes on the March
- Road to Shared Prosperity: how budget cuts are affecting American citizens
- Vacant and Condemned Properties in Minneapolis
- Flickr Mappr
Related coverage on Shareable
- Crowdsourcing Disaster Response
- Public Data Visualizations for Everyone
- Become an Armchair Cartographer
- The Visceral Neighborhood
- Five Benefits of the Crowd-Sourced City
- 10 Ways to Change the World Through Social Media