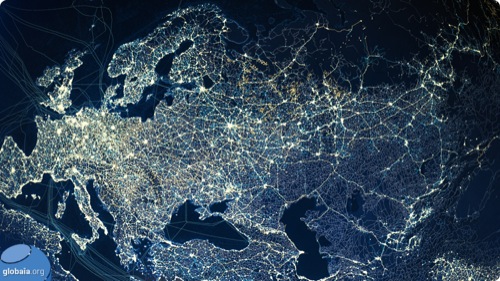
With the world networked on an unprecedented scale, and the global population hitting 7 billion only weeks ago, we are living in a uniquely interconnected era, creating new opportunites and dependencies. It's the result of millenia of exploration, travel, exploitation, and innovation, and the Anthropocene, meaning “the new human-dominated period of the Earth’s history,” is a term coined in 2000 to describe this epoch. A Cartography of the Anthropocene is an effort by global education organization Globaïa to map this epoch, illustrating the various ways that global humanity connects and is interdependent.
Anthropocene Mapping from Globaïa on Vimeo.
This year, we’ve seen Mutual Aid in Motion.
From scaling sharing hubs to Mutual Aid 101 trainings, we’re helping communities build the tools they need.
Every dollar fuels lasting resilience – proving that when we move together, we all move forward.
Using data gathered from US government agencies, anthropologist Felix Pharand-Deschenes has created a collection of maps that illustrate the various circulatory systems that connect humanity: cities, roads, railways, power lines, pipelines, cable Internet, airlines, and shipping lanes. The maps are remarkable cartographic documents of our current age, but also serve deeper research and educational purposes. Pharand-Deschenes's broader definition of the Anthropocene demonstrates his objective for the maps, taking into account the global challenges humanity faces:
A period marked by a regime change in the activity of industrial societies which began at the turn of the nineteenth century and which has caused global disruptions in the Earth System on a scale unprecedented in human history: climate change, biodiversity loss, pollution of the sea, land and air, resources depredation, land cover denudation, radical transformation of the ecumene, among others. These changes command a major realignment of our consciousness and worldviews, and call for different ways to inhabit the Earth.
A Cartography of the Anthropocene reveals the degree to which all of humanity is interconnected and interdependent. It illustrates that we cannot see ourselves as only individuals or citizens of discrete nations or states, but instead as members of a global population, sharing not only an abundance of information and products, but also scarce resources. It's a compelling provocation to find ways to share those depleting resources as willingly as we do information.
Electronic Networks Across America

Western Eurasian Networks including cities, roads, railways, tranmission lines and submarine cables

Electronic Networks Across Africa

Energy flux: Pipelines are orange; transmission lines are white ; submarine cables are turquoise

Global Transportation System: Cities are yellow ; roads are green ; ships are blue ; airlines are white
![]()
Transatlantic Air Exchanges

Via Darkside of the Force and MyModernMet. Images copyright Globaïa.
##
You might also be interested in:
- Afghans Build Open-source Internet from Trash